12. Generate the Map
Mapping
So far, you’ve coded the Occupancy Grid Mapping algorithm in C++ and generated an occupancy grid map 2D vector. Now, you'll code a visualization function that will loop through each cell. Then, you'll differentiate between occupied, free, and unknown cells depending on their log odds value. And, finally, you'll plot each cell on a graph to generate the map.
Udacity Workspace
For this quiz, you will need to use the Udacity Workspace . So, move to the next concept, enable the GPU, and Go To Desktop. Then follow these instructions:
Clone the Lab from GitHub
$ cd /home/workspace/
$ git clone https://github.com/udacity/RoboND-OccupancyGridMappingAlgorithm
Next, edit
main.cpp
Code the visualization function which will plot the state of each grid cell using the matplotlib python library
void visualization()
{
    //TODO: Initialize a plot named Map of size 300x150

    //TODO: Loop over the log odds values of the cells and plot each cell state.
    //Unkown state: green color, occupied state: black color, and free state: red color

    //TODO: Save the image and close the plot
}
Here are some helpful commands you can use to generate plots with the
matplotlib
library:
-
Set Title
:
plt::title("Your Title"); -
Set Limits
:
plt::xlim(x-axis lower limit, x-axis upper limit ); -
Plot Data
:
plt::plot({ x-value }, { y-value }, "Color and Shape"); -
Save Plot
:
plt::save("File name and directory"); -
Close Plot
:
plt::clf();
Check out this
link
for more information on the
matplotlib
C++ library. For information regarding the plot color and shape refer to the LineSpec and LineColor section of the
MATLAB
documentation.
Then, compile the program
$ cd RoboND-OccupancyGridMappingAlgorithm/
$ rm -rf Images/* #Delete the folder content and not the folder itself!
$ g++ main.cpp -o app -std=c++11 -I/usr/include/python2.7 -lpython2.7
Finally run the program
$ ./app
If you get a warning regarding the
matplotlib
library, just ignore it.
Now, wait for the program to generate the map and store it in the
/home/workspace/RoboND-OccupancyGridMappingAlgorithm/Images
directory!
Generated Map
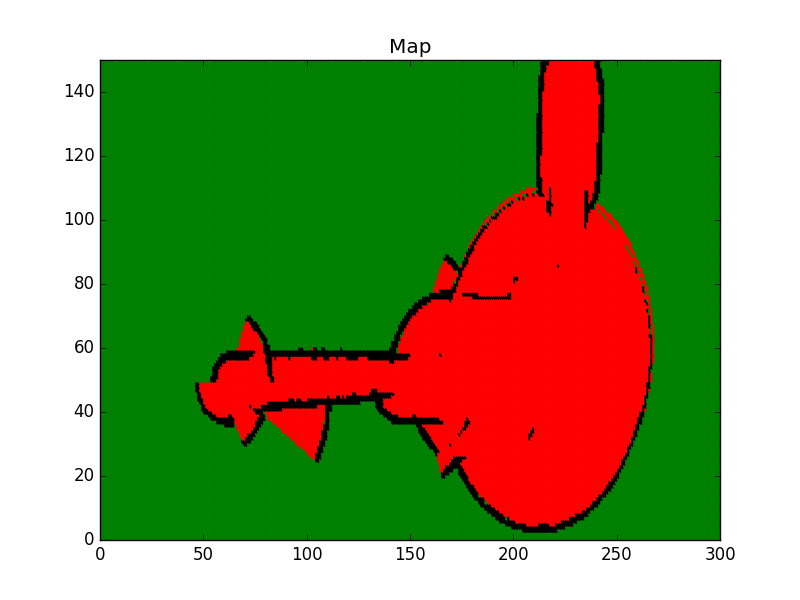
Map Legend
- Green: Unkown/Undiscovered zone
- Red: Free zone
- Black: Occupied zone